Today, our most recent paper got published, before traditional peer-review, at F1000 Research. The research is about how nominally identical fly stocks can behave completely differently even if tested by the same person in the same lab in the same test. In our case, the most commonly used wild type fly strain is called “Canton S” or CS for short (interestingly, there is no ‘Canton S’ page on Wikipedia). Virtually every Drosophila lab has a Canton S stock in their inventory, but of course, it can have been decades since these flies have seen any other Canton S flies from a different place. In evolutionary terms one would call this “reproductive isolation” meaning that there is no gene flow between the different Canton S stocks in the different labs around the world, even though they all originated from the same stock at one point and are all referenced as CS in the literature.
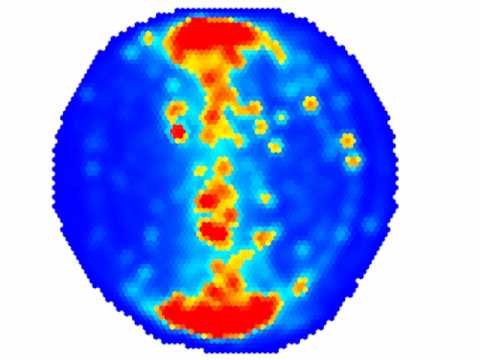
Reproductive isolation is one of several factors which are required for speciation. Therefore, we always kept the Canton S stocks we have received from different labs separate in our lab, to make sure we always have the appropriate wild type strain for any genetically manipulated strain we might get from that lab. In total, we had five different Canton S strains which we tested in Buridan’s paradigm:
Video von YouTube laden. Dabei können personenbezogene Daten an Drittanbieter übermittelt werden. Hinweise zum Datenschutz
To our amazement, it turned out that there were considerable differences between these nominally identical fly strains. In fact, the differences were large enough to have classified some of the strains ‘mutants’. As we have some knowledge about the ancestry and pedigree of each strain, we speculate that what created the differences between the strains to begin with are founder effects either when a sample was taken from one lab and transferred to the next, or during the history of the strain in an individual laboratory. It seems unlikely that there has been any significant adaptation to the particular laboratory environment, but at this point this is difficult to rule out conclusively.
This phenomenon has been observed in other model systems before and it is not quite clear how to solve it, as the logistics of developing a global “mother of all wild type stocks” are a nightmare. We felt that this issue was not considered enough in the Drosophila community and the Buridan results provide for an excellent case study. Especially in a time when reproducibility is on everybody’s agenda, it is crucial to know what can happen when trying to replicate a phenomenon that was observed in one Canton S strain elsewhere with the Canton S strain available in one’s own lab.
As replicability is also one of the issues of this paper, we decided to make the entire process of the paper as transparent as possible: not only is the paper published open access, it is also published before traditional peer-review. The ensuing peer-review will then be made open such that everyone can see what was changed in the process. The different versions of the paper will also remain accessible. Only after our paper has passed regular peer-review, will it be listed in the major indices, such as PubMed.
Above and beyond the openness of the publication process, we also decided to pioneer a technology we should have developed many years ago. In this paper, as a proof of concept, one of the figures isn’t provided by us, but we have merely sent our data as well as our R code to the publisher and the figure is generated on the fly. In the future, this will save us a tremendous amount of work: we are already setting up our lab such that our data is automatically published and accessible. The code is either open source R code from others, or made open source by us as we develop it. Hence, at the time of publication, all we need to do is write the paper and then submit just the text with the links to the data and the code together with some instructions on how to call the code to generate the figures. No more fiddling with figures ever again, once this becomes the norm – just do your experiments, write the paper and hit ‘submit’.
Another advantage of that method is that not only does it save us time and effort, it also means that reviewers and other readers only need to double click the figure to modify the code and, e.g. look at another aspect of the data. In this version we just let the user decide on different ways to plot the data, but it shows the principle behind the implementation.
In order to both broaden the database for the phenomenon studied here, and showcase the power of the technology, we are also inviting other labs to contribute their Canton S Buridan data to see how it compares to the data we have. As of now, we show data from only one additional lab in a static figure, but in future versions of the paper, we will have a dynamic figure that gets updated as new data gets uploaded by users.
I’m not deluding myself that our little paper will have much of an impact either scientifically or technologically. Of course we’d all be more than delighted if it would, but at the very least, we’re showing that even with very limited resources and some creativity, you can accomplish something that, extrapolated to a larger scale, would be transformative.


Bjorn, very curious what you are using for the figures, whether a knitr document, shiny instance, or ggvis. And how amenable F1000 was to doing things this way.
You’d have to ask the guys at F1000, perhaps on Twitter so other can see the answer, too? Julien may also know how they implemented it. F1000 Research was very amenable: I asked them what they thought about it after they demoed their plotting tool at a conference and they immediately replied they’d try it. It turned out to be more work than was anticipated (hence the second figure does not have the functionality, yet), but we’ll try to get that done in the coming revisions.