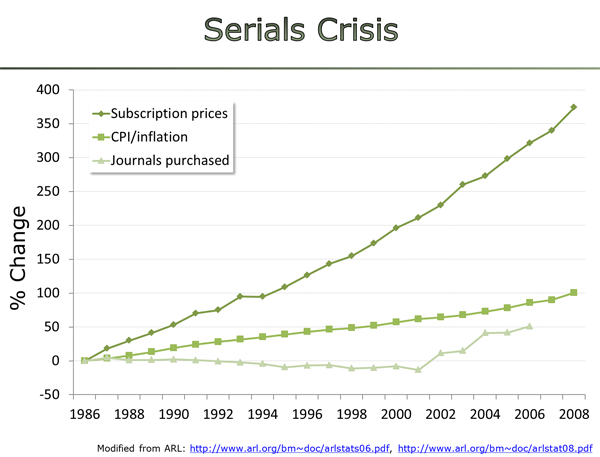
By now, it is public knowledge that subscription prices for scholarly journals have been rising beyond inflation for decades (i.e., the serials crisis):

A superficially very similar graph was recently published for APC price increases:

When not paying too much attention, both figures seem to indicate a linear increase in costs over time for both business models. However, the situation is more complicated than that. For one, the Y-axis on the subscription graph indicates percent increase per year, so this is not a linear scale when one plots the numbers in actual currency. Moreover, the subscription graph plots total cost to libraries, i.e., the increase in number of publications of about ~3% year over year is included in this figure. In other words, if one divides the yearly subscription fees by the number of articles published in that year, one arrives at a number of about US$4-5k per article.
Remarkably, and this is crucially important here, this US$4-5k number has remained fairly constant since the 1990s!
The per-article APCs, in contrast, are not constant, they increase. The number of articles we publish also increases, by about 3% every year. This means that in an APC-OA world, total spending on publishing seems likely to increase exponentially, as both the number of articles increases and the price for each article article.
In other words, to really compare both above curves, one needs to run a small model. The output of the model would be expected total costs to the tax-payer in a subscription world vs. expected costs in an APC-OA world. The assumptions of the model would be extrapolated growth curves under a subscription only scenario and an APC-OA only scenario, with price increases from the past extrapolated to the future, plus an underlying ~3% growth in papers per year (need to check exact value). Subscription article prices would remain fixed at, say, US$4,500 and the starting APC could be that last value in the APC graph above, say US$1,800. With these assumptions, it seems to me that it should just be a matter of time until the total price of publishing APC-OA overtakes subscription pricing. How soon would that be?
Who could help me plot such a comparison?
P.S.: Just to pre-empt – in the 20 years covered by the subscription graph, per-article prices ought to have dropped dramatically, so there is nothing positive in these prices staying constant.


“For one, the Y-axis on the subscription graph indicates percent increase per year, so this is not a linear scale when one plots the numbers in actual currency.”
It seems to show the percent increase since the first year. Taken literally, your formulation would suggest that the costs rose almost a factor four between 2007 and 2008, which is clearly not the case.
That would also mean that the increase in price in dollar would be a linear function of the increase in percentage. The only thing the graph hides is the absolute price. So I do not get the second part of the sentence.
“Moreover, the subscription graph plots total cost to libraries, i.e., the increase in number of publications of about ~3% year over year is included in this figure.”
That is an important difference. But a 3% growth rate means a doubling in costs every 70/3=23 years (a great rule of the thumb). The graph is about 23 years, so the costs should only have doubled, while it almost quadrupled. So something seems to be off. This graph does not suggest stable prices per article.
You are making an excellent, very astute point! Thank you!
The same issue has occurred to me when I started doing some calculations. The stable cost of US$4,000-5,000 was calculated by taking subscription revenue and dividing it by the number of articles covered by that subscription. Of course, there is some unreliability in these estimates, such as how representative the sample is of the total, or how accurate the revenue numbers are.
The total subscription cost to ARL libraries may be conflated with contingencies special for the US market and hence not representative for the entire scholarly literature.
So there is still some digging to do before one can start modeling prices. Or one just runs two different models, one with one set of assumptions and another with a second set.